第13页
- 第1页
- 第2页
- 第3页
- 第4页
- 第5页
- 第6页
- 第7页
- 第8页
- 第9页
- 第10页
- 第11页
- 第12页
- 第13页
- 第14页
- 第15页
- 第16页
- 第17页
- 第18页
- 第19页
- 第20页
- 第21页
- 第22页
- 第23页
- 第24页
- 第25页
- 第26页
- 第27页
- 第28页
- 第29页
- 第30页
- 第31页
- 第32页
- 第33页
- 第34页
- 第35页
- 第36页
- 第37页
- 第38页
- 第39页
- 第40页
- 第41页
- 第42页
- 第43页
- 第44页
- 第45页
- 第46页
- 第47页
- 第48页
- 第49页
- 第50页
- 第51页
- 第52页
- 第53页
- 第54页
- 第55页
- 第56页
- 第57页
- 第58页
- 第59页
- 第60页
- 第61页
- 第62页
- 第63页
- 第64页
- 第65页
- 第66页
- 第67页
- 第68页
- 第69页
- 第70页
- 第71页
- 第72页
- 第73页
- 第74页
- 第75页
- 第76页
- 第77页
- 第78页
- 第79页
- 第80页
- 第81页
- 第82页
- 第83页
- 第84页
- 第85页
- 第86页
- 第87页
Ⅱ. 阅读理解
话题:家务活动调查 难度:★★★ 建议用时:7’
I wanted to find out how the children in my class help at home so I did a class survey (调查). First, I chose four typical chores. Then I asked 5 boys and 7 girls the questions and got their answers. I showed the results in two different ways: first, in a pie chart (饼状图) and then on a bar chart (柱状图).
Do you ever lay the table (摆放餐具)? How do children in Class 4 help at home?
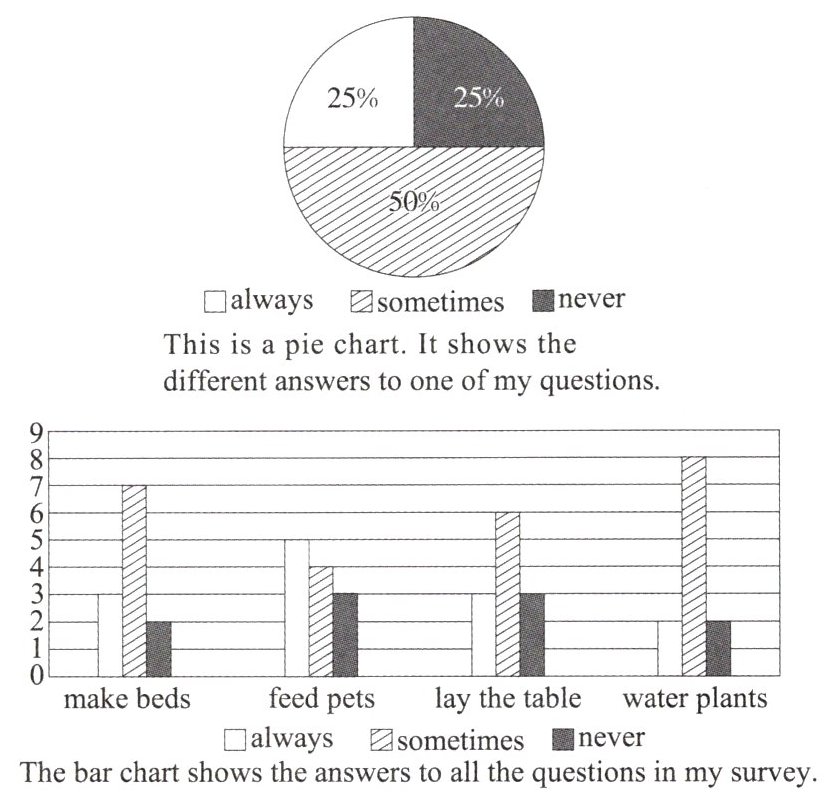
This is a pie chart. It shows the different answers to one of my questions.
The bar chart shows the answers to all the questions in my survey.
(
A. 5. B. 12. C. 7.
(
A. Never.
B. Always.
C. Sometimes.
(
A. It shows different colours of the chart.
B. It shows most of the children always lay the table.
C. It shows the result about how often the children lay the table.
(
A. sometimes lay the table
B. sometimes water plants
C. never make beds
话题:家务活动调查 难度:★★★ 建议用时:7’
I wanted to find out how the children in my class help at home so I did a class survey (调查). First, I chose four typical chores. Then I asked 5 boys and 7 girls the questions and got their answers. I showed the results in two different ways: first, in a pie chart (饼状图) and then on a bar chart (柱状图).
Do you ever lay the table (摆放餐具)? How do children in Class 4 help at home?
This is a pie chart. It shows the different answers to one of my questions.
The bar chart shows the answers to all the questions in my survey.
(
B
)1. How many children answered the survey questions?A. 5. B. 12. C. 7.
(
C
)2. How often do 50% of the students lay the table according to the pie chart?A. Never.
B. Always.
C. Sometimes.
(
C
)3. What does the pie chart show?A. It shows different colours of the chart.
B. It shows most of the children always lay the table.
C. It shows the result about how often the children lay the table.
(
B
)4. We can learn from the bar chart that 8 children ____.A. sometimes lay the table
B. sometimes water plants
C. never make beds
答案:
Ⅱ.1.B 根据“Then I asked 5 boys and 7 girls the questions and got their answers.”可知,有12位学生回答了调查的问题。故选B。
2.C 根据饼状图对应的50%可知,50%的学生偶尔摆放餐具。故选C。
3.C 根据饼状图“It shows the different answers to one of my questions.”和柱状图中“Do you ever lay the table?”部分的数据相同可知,饼状图展示的是学生们摆放餐具的频率。故选C。
4.B 根据柱状图可知,8个学生对应的是sometimes water plants。故选B。
2.C 根据饼状图对应的50%可知,50%的学生偶尔摆放餐具。故选C。
3.C 根据饼状图“It shows the different answers to one of my questions.”和柱状图中“Do you ever lay the table?”部分的数据相同可知,饼状图展示的是学生们摆放餐具的频率。故选C。
4.B 根据柱状图可知,8个学生对应的是sometimes water plants。故选B。
查看更多完整答案,请扫码查看