第57页
- 第1页
- 第2页
- 第3页
- 第4页
- 第5页
- 第6页
- 第7页
- 第8页
- 第9页
- 第10页
- 第11页
- 第12页
- 第13页
- 第14页
- 第15页
- 第16页
- 第17页
- 第18页
- 第19页
- 第20页
- 第21页
- 第22页
- 第23页
- 第24页
- 第25页
- 第26页
- 第27页
- 第28页
- 第29页
- 第30页
- 第31页
- 第32页
- 第33页
- 第34页
- 第35页
- 第36页
- 第37页
- 第38页
- 第39页
- 第40页
- 第41页
- 第42页
- 第43页
- 第44页
- 第45页
- 第46页
- 第47页
- 第48页
- 第49页
- 第50页
- 第51页
- 第52页
- 第53页
- 第54页
- 第55页
- 第56页
- 第57页
- 第58页
- 第59页
- 第60页
- 第61页
- 第62页
- 第63页
- 第64页
- 第65页
- 第66页
- 第67页
- 第68页
- 第69页
- 第70页
- 第71页
- 第72页
Ⅰ Complete the sentences with the right forms of the following phrases.
succeed in too... to except for
not... any more make jokes about
1. Her grandfather is
2. Mr Smith is a good man
3. Though they met many difficulties, they
4. The naughty boy always
5. I will
succeed in too... to except for
not... any more make jokes about
1. Her grandfather is
too
old to
carry the heavy suitcase.2. Mr Smith is a good man
except for
his bad temper (脾气).3. Though they met many difficulties, they
succeeded in
setting up their own company.4. The naughty boy always
makes jokes about
his classmates, so none of them likes him.5. I will
not
play computer games any more
. I will study hard from now on.
答案:
1. too; to
2. except for
3. succeeded in
4. makes jokes about
5. not; any more
2. except for
3. succeeded in
4. makes jokes about
5. not; any more
Ⅱ Text feature: Line graph.
Line graph is a visual comparison of how two variables—shown on the x-and y-axes—are related or vary with each other. It shows related information by drawing a continuous line between all the points on a grid.
One example:
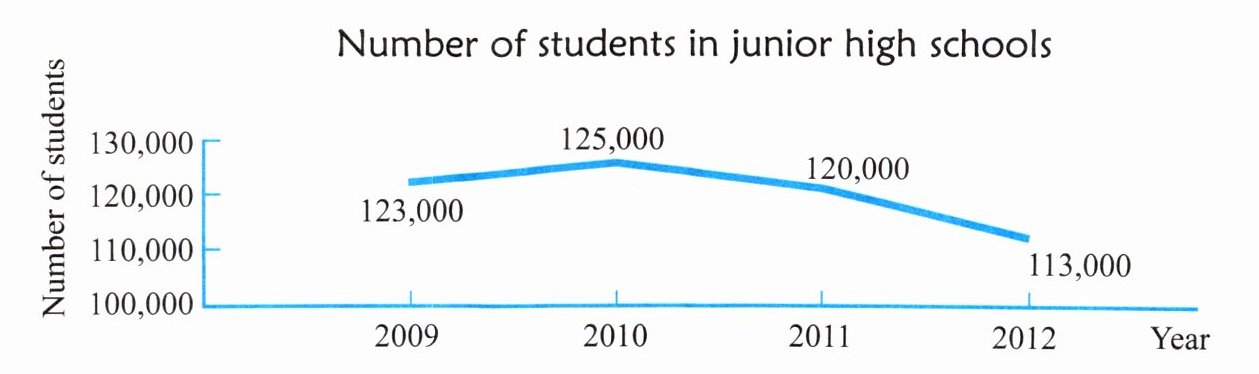
Look at the line graph above about the number of students in junior high schools in May's city. The graph shows that there were 123,000 students in 2009 in May's city. In 2010, the number rose to 125,000 and then fell to 120,000 in 2011. In 2012, the number fell again to 113,000.
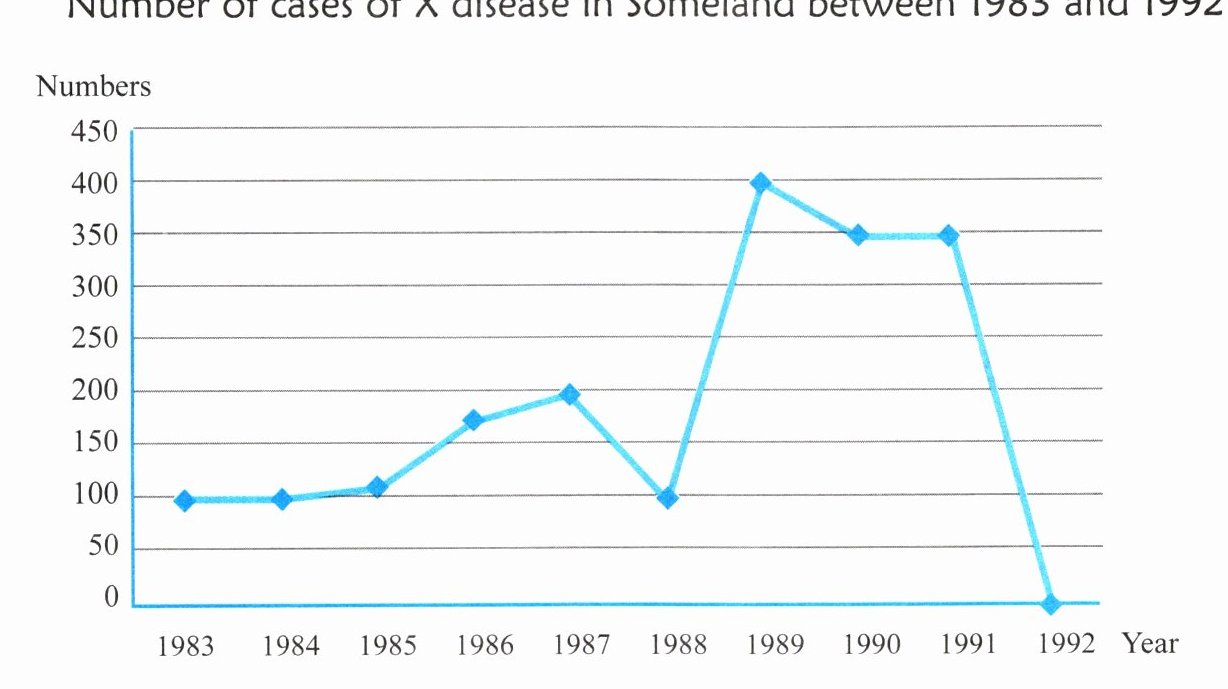
Write a report about the number of cases of X disease in Someland between 1983 and 1992.
Number of cases of X disease in Someland between 1983 and 1992
Line graph is a visual comparison of how two variables—shown on the x-and y-axes—are related or vary with each other. It shows related information by drawing a continuous line between all the points on a grid.
One example:
Look at the line graph above about the number of students in junior high schools in May's city. The graph shows that there were 123,000 students in 2009 in May's city. In 2010, the number rose to 125,000 and then fell to 120,000 in 2011. In 2012, the number fell again to 113,000.
Write a report about the number of cases of X disease in Someland between 1983 and 1992.
Number of cases of X disease in Someland between 1983 and 1992
答案:
Look at the line graph about the number of cases of X disease in Someland between 1988 and 1992. The graph shows that there were 100 cases of X disease in 1988 in Someland. In 1989, the number rose to 400 and then fell to 350 in 1990. In 1992, the number fell again to 0.
查看更多完整答案,请扫码查看